
Yesterday’s snapshot showed the asking side of September: a $446,450 median list price (down 9.8% from last year), 80 median days on market, and 27.3% of listings carrying a price cut. That’s what sellers were hoping for. Now the closed numbers show what buyers actually paid — and the two sides tell one consistent story.
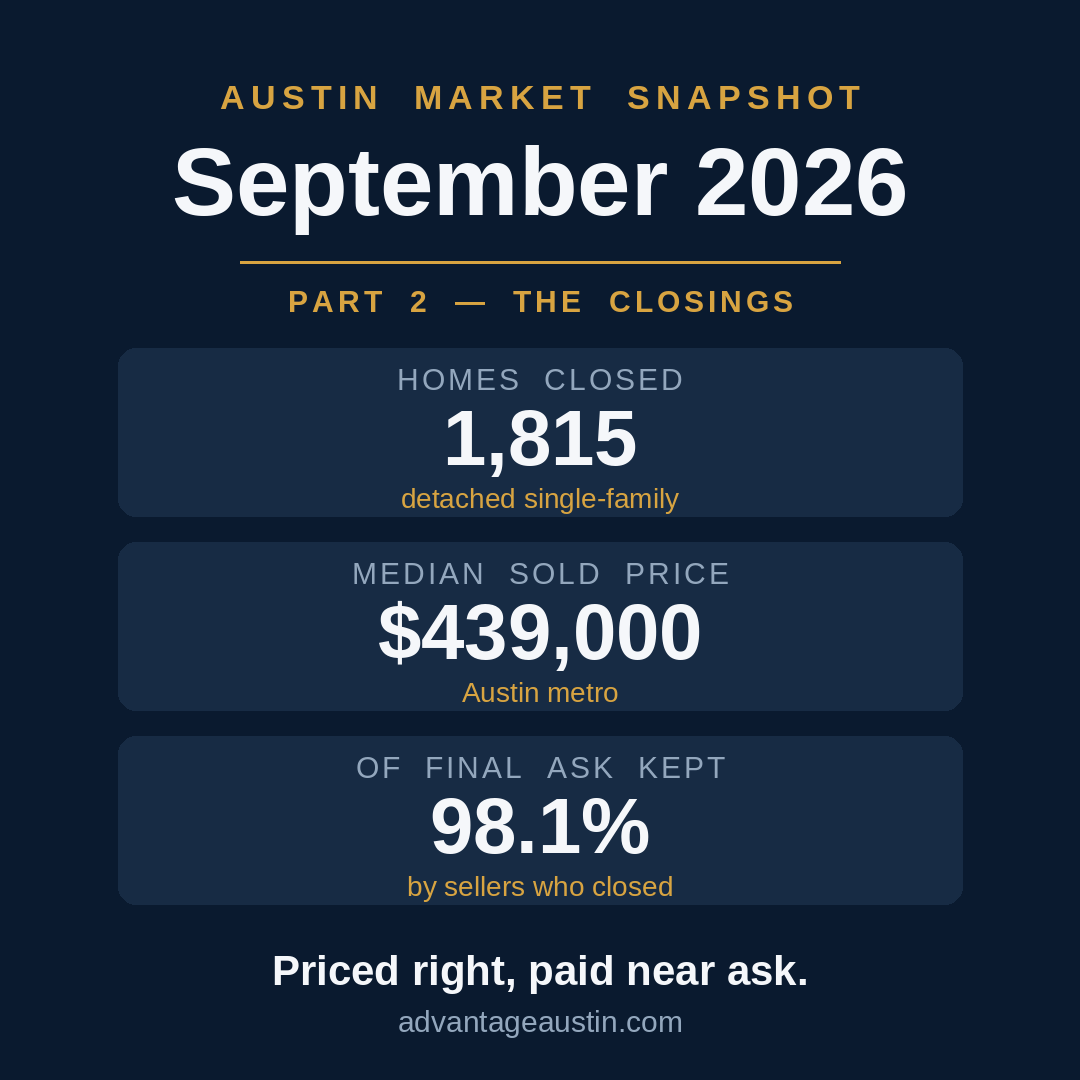
1,815 detached single-family homes closed across the Austin metro in September at a $439,000 median sold price. Homes that sold moved in a median of 53 days — notably faster than the 80-day listing-side average, which is inflated by the listings that sat. Sellers who closed kept 98.1% of their final asking price.
That 98.1% number is the one that matters most. It compares the closing price to the final list price — after any cuts. And September saw plenty of cuts: 5,043 listings took at least one price reduction during the month. The pattern is clear: sellers who adjusted to the market got paid near their ask. Sellers who held out are the ones sitting in that 80-day average.
So the leverage story from yesterday’s snapshot holds, with a refinement. Buyers aren’t stealing homes — they’re buying the homes that were priced to sell. The gap between the $446K median ask and the $439K median sold price is the market doing its job: repricing until the deal clears.
Austin isn’t an outlier, either. Nationally, NAR’s September existing-home sales report shows the same shape: sales at a 3.99 million annual pace, down 2.2% from a year ago; inventory up to 1.60 million homes, a 4.8-month supply; and a median 33 days on market. NAR chief economist Lawrence Yun put it plainly: “Higher inventory and lengthening days on market give buyers improved negotiating power” — and sellers, he added, may need price discounts and other incentives to attract buyers. That’s the national version of exactly what Austin’s closings just showed.
One headwind to watch: the 30-year fixed averaged 7.40% in the week ending October 15 (Freddie Mac) — a near three-year high that finally ended seven straight weeks of increases — and Bankrate’s daily national average eased to 7.46% on Oct 16, down from 7.50% the day before. The turn came from the bond market: after Wednesday’s hot September CPI print (core 2.6% year-over-year vs 2.5% expected) briefly pushed the 10-year Treasury to ~5.30% and October Fed hike odds from about 22% to about 39%, safe-haven demand (a tech-stock selloff, Iran-war risk) dragged the 10-year back down to ~5.06–5.12%, a three-week low — even Thursday’s hot PPI (+1.3% MoM) and strong retail sales (+0.8%) couldn’t move bonds higher. Update Oct 20: Warsh gave no October signal on Friday, and markets now expect a hold at the Oct 27–28 meeting; Bankrate’s daily average is 7.47% today, and Fannie Mae now forecasts 30-year rates in the 7.50% range for all of 2027. Net: rates are parked at the top of the range rather than breaking through it, but the underlying inflation trend is still ugly, so price-to-sell discipline matters just as much. Realtor.com’s economists note sellers are cutting prices at a rate not seen in four years as financing costs squeeze buyers, which is why the price-to-sell discipline is only getting more important.
Bottom line for sellers: price to the comps, not to last year’s hopes, and you’ll close near ask. Bottom line for buyers: the 11,301 active listings are your negotiating room — use it, but the good ones don’t wait 80 days.
Closed figures are detached single-family homes, source: Unlock MLS via MLS Grid analysis (Ready Front, Oct 2, 2026) — checked Oct 16 against the official Unlock MLS September 2026 report (published Oct 13): no material discrepancies. Listing-side figures are Realtor.com September metro data. National figures: NAR September 2026 existing-home sales report (released Oct 13).